Search site
Atlas

Species list
Powered by Squarespace
Navigation

Entries in 1980s BTO winter atlas (154)

Sunday
Oct092011

Pied Wagtail - 1980s winter atlas

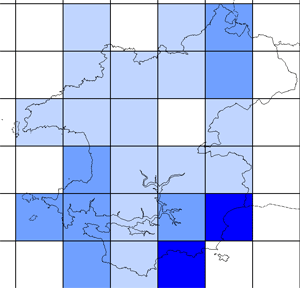
The BTO winter atlas showed that Pied Wagtails were present in most 10km squares during the winters of 1981-82, 1982-82 and 1983-84.

The darker the colour, the higher the relative total count for each 10km square.  The darkest blue represents over 19 birds seen in a day, as at roosts.

Graham Rees
Sunday
Oct092011

Pheasant - 1980s winter atlas

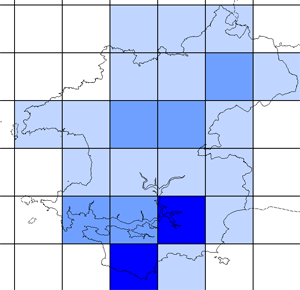
The BTO winter atlas showed that Pheasants were present in most 10km squares during the winters of 1981-82, 1982-82 and 1983-84.

The darker the colour, the higher the relative total count for each 10km square.  The darkest blue represents over 9-33 birds seen in a day. Releases of birds reared for shooting varies year by year, so the map represents a snapshot limited to the winters in which the survey was conducted.


Graham Rees

Sunday
Oct092011

Peregrine - 1980s winter atlas

The BTO winter atlas showed that Peregrines were present in most 10km squares during the winters of 1981-82, 1982-82 and 1983-84.

The darker the colour, the higher the relative total count for each 10km square.  The darkest blue represents over 3 birds and refers to birds in estuarine habitat.


Graham Rees

Sunday
Oct092011

Oystercatcher - 1980s winter atlas

The BTO winter atlas showed that Oystercatchers were present in all coastal and estuarine 10km squares during the winters of 1981-82, 1982-82 and 1983-84.

The darker the colour, the higher the relative total count for each 10km square.  The darkest blue represents 45-225 birds.

Graham Rees

Sunday
Oct092011

Mediterranean Gull: 1980s winter atlas


The BTO winter atlas showed that single Mediterranean Gulls were noted in five Pembrokeshire 10km squares during the winters of 1981-82, 1982-82 and 1983-84.


Graham Rees

Sunday
Oct092011

Mute Swan - 1980s winter atlas

The BTO winter atlas showed that Mute Swans were present in suitable 10km squares during the winters of 1981-82, 1982-82 and 1983-84.

The darker the colour, the higher the relative total count for each 10km square.  The darkest blue represents over 24 birds seen in a day.

The distribution plot highlights the square that includes Pembroke Mill Ponds where the largest concentration in the county occurred.

Graham Rees

Sunday
Oct092011

Marsh Tit - 1980s winter atlas

The BTO winter atlas showed that Marsh Tits were present in the majority of 10km squares during the winters of 1981-82, 1982-82 and 1983-84.

The darker the colour, the higher the relative total count for each 10km square.  The darkest blue represents over 8 birds.

However, it should be noted that the figures show a high correlation with the number of recording cards returned (therefore related to recording effort) for each 10km square. 

Graham Rees

Sunday
Oct092011

Long-tailed Tit - 1980s winter atlas


The BTO winter atlas showed that Long-tailed Tits were present in most 10km squares during the winters of 1981-82, 1982-82 and 1983-84.


The darker the colour, the higher the relative total count for each 10km square.  The darkest blue represents 16-28 birds.


Graham Rees

Sunday
Oct092011

Greenfinch - 1980s winter atlas

Sunday
Oct092011

Goldfinch - 1980s winter atlas

The BTO winter atlas showed that Goldfinches were present in most 10km squares during the winters of 1981-82, 1982-82 and 1983-84.

The darker the colour, the higher the relative total count for each 10km square.  The darkest blue represents over 26 birds.

However, it should be noted that the figures show a high correlation with the number of recording cards returned (therefore related to recording effort) for each 10km square. 

Graham Rees 

Sunday
Oct092011

Goldcrest - 1980s winter atlas

The BTO winter atlas showed that Goldcrests were present in most 10km squares during the winters of 1981-82, 1982-82 and 1983-84.

The darker the colour, the higher the relative total count for each 10km square.  The darkest blue represents over 20 birds.

However, it should be noted that the figures show a high correlation with the number of recording cards returned (therefore related to recording effort) for each 10km square. 

Graham Rees 

Sunday
Oct092011

Little Auk: 1980s winter atlas


The BTO winter atlas showed that Little Auks were noted in three Pembrokeshire 10km squares during the winters of 1981-82, 1982-82 and 1983-84. These were single birds noted inshore following onshore gales.


Graham Rees