Search site
Atlas

Species list
Powered by Squarespace
Navigation

Entries in GHR (356)

Sunday
Oct092011

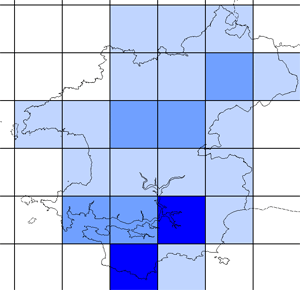
Pied Wagtail - 1980s winter atlas

The BTO winter atlas showed that Pied Wagtails were present in most 10km squares during the winters of 1981-82, 1982-82 and 1983-84.

The darker the colour, the higher the relative total count for each 10km square.  The darkest blue represents over 19 birds seen in a day, as at roosts.

Graham Rees
Sunday
Oct092011

Pheasant - 1980s winter atlas

The BTO winter atlas showed that Pheasants were present in most 10km squares during the winters of 1981-82, 1982-82 and 1983-84.

The darker the colour, the higher the relative total count for each 10km square.  The darkest blue represents over 9-33 birds seen in a day. Releases of birds reared for shooting varies year by year, so the map represents a snapshot limited to the winters in which the survey was conducted.


Graham Rees

Sunday
Oct092011

Peregrine - 1980s winter atlas

The BTO winter atlas showed that Peregrines were present in most 10km squares during the winters of 1981-82, 1982-82 and 1983-84.

The darker the colour, the higher the relative total count for each 10km square.  The darkest blue represents over 3 birds and refers to birds in estuarine habitat.


Graham Rees

Sunday
Oct092011

Oystercatcher - 1980s winter atlas

The BTO winter atlas showed that Oystercatchers were present in all coastal and estuarine 10km squares during the winters of 1981-82, 1982-82 and 1983-84.

The darker the colour, the higher the relative total count for each 10km square.  The darkest blue represents 45-225 birds.

Graham Rees

Sunday
Oct092011

Mediterranean Gull: 1980s winter atlas


The BTO winter atlas showed that single Mediterranean Gulls were noted in five Pembrokeshire 10km squares during the winters of 1981-82, 1982-82 and 1983-84.


Graham Rees

Sunday
Oct092011

Mute Swan - 1980s winter atlas

The BTO winter atlas showed that Mute Swans were present in suitable 10km squares during the winters of 1981-82, 1982-82 and 1983-84.

The darker the colour, the higher the relative total count for each 10km square.  The darkest blue represents over 24 birds seen in a day.

The distribution plot highlights the square that includes Pembroke Mill Ponds where the largest concentration in the county occurred.

Graham Rees

Sunday
Oct092011

Marsh Tit - 1980s winter atlas

The BTO winter atlas showed that Marsh Tits were present in the majority of 10km squares during the winters of 1981-82, 1982-82 and 1983-84.

The darker the colour, the higher the relative total count for each 10km square.  The darkest blue represents over 8 birds.

However, it should be noted that the figures show a high correlation with the number of recording cards returned (therefore related to recording effort) for each 10km square. 

Graham Rees

Sunday
Oct092011

Long-tailed Tit - 1980s winter atlas


The BTO winter atlas showed that Long-tailed Tits were present in most 10km squares during the winters of 1981-82, 1982-82 and 1983-84.


The darker the colour, the higher the relative total count for each 10km square.  The darkest blue represents 16-28 birds.


Graham Rees

Sunday
Oct092011

Goldfinch - 1980s winter atlas

The BTO winter atlas showed that Goldfinches were present in most 10km squares during the winters of 1981-82, 1982-82 and 1983-84.

The darker the colour, the higher the relative total count for each 10km square.  The darkest blue represents over 26 birds.

However, it should be noted that the figures show a high correlation with the number of recording cards returned (therefore related to recording effort) for each 10km square. 

Graham Rees 

Sunday
Oct092011

Goldcrest - 1980s winter atlas

The BTO winter atlas showed that Goldcrests were present in most 10km squares during the winters of 1981-82, 1982-82 and 1983-84.

The darker the colour, the higher the relative total count for each 10km square.  The darkest blue represents over 20 birds.

However, it should be noted that the figures show a high correlation with the number of recording cards returned (therefore related to recording effort) for each 10km square. 

Graham Rees 

Sunday
Oct092011

Little Auk: 1980s winter atlas


The BTO winter atlas showed that Little Auks were noted in three Pembrokeshire 10km squares during the winters of 1981-82, 1982-82 and 1983-84. These were single birds noted inshore following onshore gales.


Graham Rees

Sunday
Oct092011

Linnet - 1980s winter atlas


The BTO winter atlas showed that Linnets were present in most 10km squares during the winters of 1981-82, 1982-82 and 1983-84.


The darker the colour, the higher the relative total count for each 10km square.  The darkest blue represents over 99 birds.


Linnets can be difficult to find in wintertime because the majority can flock in small areas.


Graham Rees