Lesser Spotted Woodpecker - 1980s winter atlas
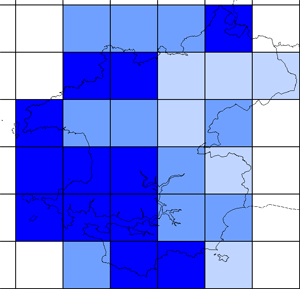
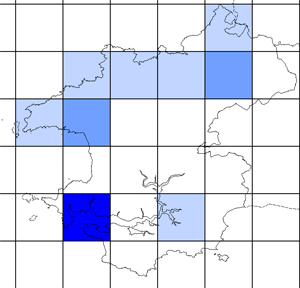
The BTO winter atlas showed that Lesser Spotted Woodpeckers were noted in two Pembrokeshire 10km squares during the winters of 1981-82, 1982-82 and 1983-84.
Graham Rees
The BTO winter atlas showed that Lesser Spotted Woodpeckers were noted in two Pembrokeshire 10km squares during the winters of 1981-82, 1982-82 and 1983-84.
Graham Rees
The BTO winter atlas showed that few Lesser Redpolls were present in Pembrokeshire 10km squares during the winters of 1981-82, 1982-82 and 1983-84.
The plotted colour represents 1-10 birds seen in a day.
Graham Rees
The BTO winter atlas showed that Lesser Black-backed Gulls were present in most 10km squares during the winters of 1981-82, 1982-82 and 1983-84.
The darker the colour, the higher the relative total count for each 10km square, the darkest blue represents over 46 birds. Over 2,000 were recorded roosting at Llys y fran reservoir during this period.
Graham Rees
The BTO winter atlas showed that Lapwings were present in most 10km squares during the winters of 1981-82, 1982-82 and 1983-84.
The darker the colour, the higher the relative total count for each 10km square, the darkest blue represents over 1,500 birds.
Graham Rees
The BTO winter atlas showed that Knots were present in some coastal and estuarine 10km squares during the winters of 1981-82, 1982-82 and 1983-84.
The colour, for each 10km square represents 1-32 birds.
Graham Rees
The BTO winter atlas showed that Kittiwakes were present in six coastal and one estuarine 10km squares during the winters of 1981-82, 1982-82 and 1983-84.
The darker the colour, the higher the relative total count for each 10km square. The darkest blue represents over 43 birds, numerical presence varying with the strength of onshore winds.
Graham Rees
The BTO winter atlas showed that Kestrels were present in most 10km squares during the winters of 1981-82, 1982-82 and 1983-84.
The darker the colour, the higher the relative total count for each 10km square. The darkest blue represents over 3-4 birds.
Graham Rees
The BTO winter atlas showed that Jackdaws were present in most 10km squares during the winters of 1981-82, 1982-82 and 1983-84.
The darker the colour, the higher the relative total count for each 10km square. The darkest blue represents over 400 birds.
The map plot reflects winter flocking in the coastal plain and consequent large roosts.
Graham Rees
The BTO winter atlas showed that Jack Snipes were present in a third of Pembrokeshire 10km squares during the winters of 1981-82, 1982-82 and 1983-84.
The darker the colour, the higher the relative total count for each 10km square. The darkest blue represents over 4 birds recorded per day.
Probably under recorded as usually not discovered until almost trodden on.
Graham Rees
The BTO winter atlas showed that House Sparrows were present in most 10km squares during the winters of 1981-82, 1982-82 and 1983-84.
The darker the colour, the higher the relative total count for each 10km square. The darkest blue represents over 65 birds.
The winter distribution was similar to the breeding range plotted in the 1970s.
Graham Rees
The BTO winter atlas showed that Herring Gulls were present in most 10km squares during the winters of 1981-82, 1982-82 and 1983-84.
The darker the colour, the higher the relative total count for each 10km square. The darkest blue represents over 400 birds.
All squares were used for feeding purposes but the largest concentrations were at coastal roost sites
Graham Rees
The BTO winter atlas showed that Hen Harriers were present in a third of Pembrokeshire 10km squares during the winters of 1981-82, 1982-82 and 1983-84.
The darker the colour, the higher the relative total count for each 10km square. The darkest blue represents over 3 birds recorded per day.
Graham Rees