Search site
Atlas

Species list
Powered by Squarespace
Navigation

Entries in GHR (356)

Friday
Sep162011

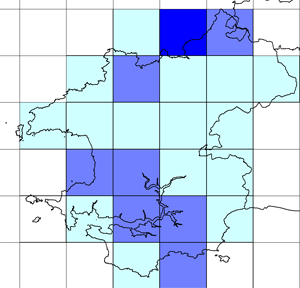
Common Sandpiper - 1980s winter atlas

The BTO winter atlas showed that Common Sandpipers were present in six estuarine 10km squares during the winters of 1981-82, 1982-82 and 1983-84.

The darkest colour represents 2 birds seen a day, the lighter blue represents one bird in a day. The UK is at the northern extremity of the winter range of this species.

Graham Rees 
Friday
Sep162011

Common Gull - 1980s winter atlas

The BTO winter atlas showed that Common Gulls were present in most 10km squares during the winters of 1981-82, 1982-82 and 1983-84.

The darker the colour, the higher the relative total count for each 10km square.  The darkest blue represents up to 400 birds in a day.

Found extensively using wet pasture and newly ploughed land but all roosts reported were around the estuaries.

Graham Rees 


Friday
Sep162011

Collared Dove - 1980s winter atlas


The BTO winter atlas showed that Collared Doves were present in most 10km squares during the winters of 1981-82, 1982-82 and 1983-84.

The darker the colour, the higher the relative total count for each 10km square.  The darkest blue represents over 50 birds in a day, reflecting winter flocking.

Graham Rees

Friday
Sep162011

Coal Tit - 1980s winter atlas


The BTO winter atlas showed that Coal Tit were present in most 10km squares during the winters of 1981-82, 1982-82 and 1983-84.

The darker the colour, the higher the relative total count for each 10km square.  The darkest blue represents over 18 birds in a day. Probably numerically under recorded in dense conifer plantations during winter when they do not normally reveal themselves by singing.

Graham Rees 

Friday
Sep162011

Chough - 1980s winter atlas

The BTO winter atlas showed that Choughs were recorded in most coastal 10km squares during the winters of 1981-82, 1982-82 and 1983-84.

The darkest blue on the map represents over 5-11 birds seen in a day, meaning immature birds were recorded as well as territory holding adults.

 Graham Rees

Friday
Sep162011

Chiff-chaff - 1980s winter atlas

The BTO winter atlas showed that Chiffchaffs were present in 41% of 10km squares during the winters of 1981-82, 1982-82 and 1983-84.

The darker the colour, the higher the relative total count for each 10km square.  The darkest blue represents 3 or more birds seen in a day.

However, it should be noted that the figures show a high correlation with the number of recording cards returned (therefore related to recording effort) for each 10km square. 

Graham Rees 

Friday
Sep162011

Canada Goose - 1980s winter atlas


The BTO winter atlas showed that Canada Geese were present in only one 10km square during the winters of 1981-82, 1982-82 and 1983-84. 

The mid blue colour in the square represents over 27-121 birds recorded in a day. About 100 Canada Geese remained in the Boulston area of the Western Cleddau which is where they were introduced in 1955.

Graham Rees

Friday
Sep162011

Buzzard - 1980s winter atlas

The BTO winter atlas showed that Buzzards were present in most 10km squares during the winters of 1981-82, 1982-82 and 1983-84.

The darkest blue represents over 7 birds recorded in a day, the next lightest 3-6 birds, suggesting fairly even distribution.

Graham Rees 

Friday
Sep162011

Bullfinch - 1980s winter atlas

The BTO winter atlas showed that Bullfinches were present in most 10km squares during the winters of 1981-82, 1982-82 and 1983-84.

The darker the colour, the higher the relative total count for each 10km square.  The darkest blue represents over 15 birds recorded in a day. The largest gatherings were due to birds from the surrounding neighbourhood gathering at good local food sources.

Graham Rees

Friday
Sep162011

Brent Goose - 1980s winter atlas

The BTO winter atlas showed that Brent Geese were present in two 10km squares during the winters of 1981-82, 1982-82 and 1983-84.

The light colour, of the10km squares represents 1-15 birds seen in a day, the most in Pembrokeshire being six.

Graham Rees 


Friday
Sep162011

Brambling - 1980s winter

The BTO winter atlas showed that Bramblings were present in few 10km squares during the winters of 1981-82, 1982-82 and 1983-84.

The darker the colour, the higher the relative total count for each 10km square.  The darkest blue represents over 41 birds.

Small numbers were erratic in occurrence in Pembrokeshire but occasionally larger groups gathered at good food sources, as shown on map. 

Graham Rees

Friday
Sep162011

Blue Tit - 1980s winter


The BTO winter atlas showed that Blue Tits were present in most 10km squares during the winters of 1981-82, 1982-82 and 1983-84.

The darker the colour, the higher the relative total count for each 10km square.  The darkest blue represents over 70 birds.  


However, it should be noted that the figures show a high correlation with the number of recording cards returned (therefore related to recording effort) for each 10km square.  

Graham Rees