The Pembrokeshire Breeding Bird Atlas 2003-07 provides an update to the 1994 Birds of Pembrokeshire, covering the breeding species.
The Atlas of Breeding Birds of Pembrokeshire 2003-2007 is available as a print-on-demand publication by clicking here
THE MAKING OF THE ATLAS
Introduction
The county of Pembrokeshire is some 158,000 hectares (613 square miles) in extent, with its southern, western and northern boundaries all coastal. The climate is maritime, with strong oceanic influences found also in the type and distribution of fauna and flora.
A review of all the species of birds recorded in the county in all seasons is to be found in the "Birds of Pembrokeshire" by Jack Donovan and Graham Rees, published in 1994 and including a breeding bird atlas based on fieldwork done in 1884-88. This important publication provided a baseline on which to compare mapped distributions and population estimates of different species within the county.
The populations of any animals that can walk, fly, swim or crawl will change in numbers and distribution over a period of time, so that any atlas will become out of date over a period of years, decades or centuries.
Biodiversity is the buzzword, and the need to know what species are where has become important, indeed a requirement, for planning and conservation purposes.
Trends towards milder and windier winters, and towards cloudier, wetter summers, may herald longer term climate change. But there is already anecdotal evidence, as well as indications from country-wide surveys, that there are other changes happening in the natural world.
At a local level, it was decided that the "Birds of Pembrokeshire" should be updated. This breeding birds atlas is first stage in that process. It does, indeed, show that there have been changes, both losses and gains, within the 15 to 20 years between the two fieldwork periods
Methodology
On the 2nd September 2002 the Pembrokeshire Bird Group convened a meeting at “The Patch”, Furzey Park, Haverfordwest, to discuss the desirability of producing a new avifauna for Pembrokeshire. All interested parties were invited to attend and those interested but unable to attend were encouraged to communicate their views.
The meeting agreed to go ahead with such a project and that it should encompass a breeding birds survey using a tetrad (2km x 2km) grid. To this end an Avifauna Committee was elected, comprised of Graham Rees (chair), Annie and Bob Haycock, Jane Hodges, Trevor Price, and Mike Young-Powell.
At their first meeting, the committee decided that the breeding survey should be the first aspect to be addressed. It was to run from 2003 to 2007 and to take the same form as the 1984-88 survey so that the two would be directly comparable. The 1984-88 survey was the first in the county to use as fine a scale as the tetrad grid. It was also the first attempt made to estimate the size of the breeding population of each species in the county.
Recording forms and accompanying instructions (see appendix IV) were printed and distributed in time for field work to begin in 2003.
Data from completed recording forms, representing some 30,000 records from 490 tetrads, were entered on computer by a small team comprising John and Marion Best, Annie and Bob Haycock, Fiona and Trevor Price, using the computer software package MapMate. A summary of the records from the 1984-88 survey was similarly entered, so that comparable maps could be generated.
The methods used for atlas fieldwork followed those of The Atlas of Breeding Birds in Britain and Ireland (Sharrock 1976) but recorded at the tetrad level rather than hectad (10km x 10km) level. For our local atlas however, adjustments have been made in as much as the islands of Grassholm, Caldey, Skokholm and Ramsey have been regarded as occupying one tetrad each, while Skomer and Middleholm have been treated as a composite tetrad. As in that first national atlas, the final maps are populated with small dots to indicate that a species was present during the breeding season, medium-sized dots to show that it probably bred, and large dots to show that breeding was confirmed, as shown in figure 1:
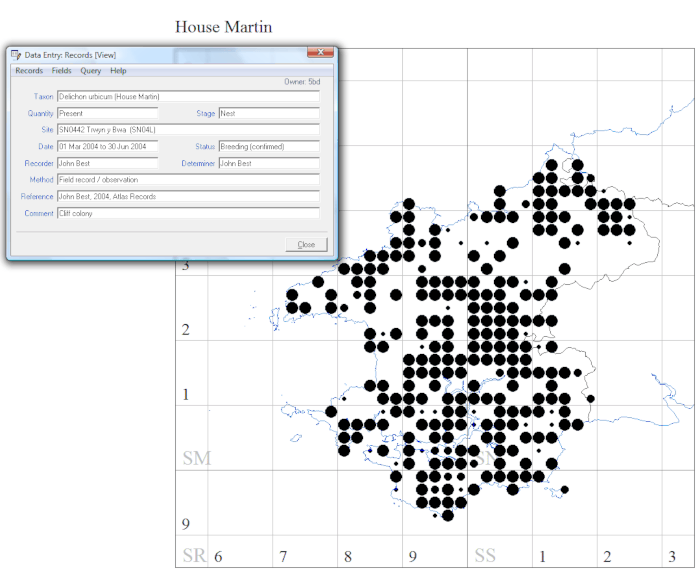
The example map above shows the data entry record card in MapMate that helps generate distribution maps. Records entered this way gradually build up a growing series of distribution dots on a map, Each record entered represents a breeding registration for a particular species in a particular tetrad. The species in this case is House Martin and the tetrad is SN04L (SN0442 Trwyn y Bwa).
The more visits that are made to a particular tetrad, the more information there is behind each dot providing an eventual final outcome - in this case the largest dot showing confirmed breeding. In other tetrads medium dots represent probable breeding (e.g. bird showing territorial behaviour or visiting potential nest site, and probably went on to breed successfully) while the small dots show that the species was present in a tetrad at some time during the survey, but no evidence was found to indicate that it was doing more than feeding or resting there.
Another team of volunteers, comprising Graham Rees, Bob Haycock, Jane Hodges, Steve Sutcliffe, Paddy Jenks and Richard Dobbins wrote the individual species accounts. Annie Haycock then assembled the maps and texts into this volume.
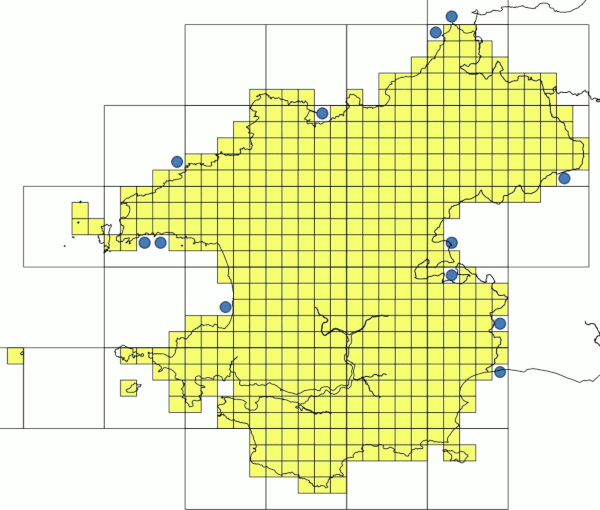
The map below shows the tetrads covered in the 1984-88 atlas (in yellow) and 12 extra tetrads (blue dots) covered during the 2003-07 period. These were all peripheral tetrads, either coastal or along the county boundary, and including only a small amount of land.
Population estimates
The 2003-07 Pembrokeshire breeding survey was deliberately undertaken using the same methodology as the previous 1984-88 survey, so that the two were directly comparable. It should, therefore prove useful in assessing biodiversity, species distribution changes and perhaps in evaluating the effects of changes in weather patterns over the period.
However, there are limitations to the information gathered by this kind of survey. It is basically a presence or absence survey, with some additional value in terms of proving whether or not species was breeding throughout the area. Nonetheless, it does give a reasonable indication of the spatial distribution of each species, and whether a species is localised, is widespread occurring in most tetrads, or is widespread but scattered.
The results take no account of time spent in the field in each tetrad, or of observer bias or competence. Figure 2 shows the number of species recorded in each tetrad in each atlas period (all species are included, whether or not they showed signs of breeding). In the later period there appears to have been a shift away from the north, with more species recorded in the south-east and on the St. David's peninsula. While some of this shift may be genuine, some of it is likely to be observer bias as people inevitably record closer to their home areas unless directed to do otherwise.
People were not asked to count birds whilst recording in tetrads during the main 2003-07 survey. The limited population data collected as part of the BAP breeding survey applied to nature reserves and other special areas, and so was not directly applicable to the county as a whole.
For the 1984-88 atlas, population estimates were compiled from survey results combined with extensive personal experience (of the authors) within the county (Donovan & Rees 1994). These estimates provided a baseline used to inform population estimates for the 2003-07 atlas. For example, an increase in the number of tetrads recorded for a species was assumed to have the same proportional increase in population. For a few species, e.g. Yellowhammer, anecdotal evidence indicated that has there has been a thinning out of the population, while for others, such as Chough, long term surveillance of nest sites showed there has been an increase in the breeding density, at least in some areas. This approach therefore has limitations.
It will be noticed in the accounts for many species, that the results of the 1988-91 National Atlas (Gibbons et al) have been used in testing the original estimates made following the pioneering 1984-88 local atlas. For a few species, this has resulted in a revision of the original local population estimate and is explained in the individual species text.
The BTO/JNCC/RSPB Breeding Bird Survey (BBS), which came into being in 1994, also provides a useful tool for estimating populations. This survey is carried out nationally, and provides indices of the populations of birds in Britain in summer. These indices are based on both the changes in numbers of each species counted along two parallel 1km transects in a 1km square, and on changes in the percentage of squares in which they occur.
For most species in this atlas, a new population size has been estimated, based on a combination of data from the 1984-88 fieldwork, the 2003-07 distribution maps, the results from the 1988-91 National Atlas, and the BBS indices for Wales. The current National Atlas (fieldwork in progress at the time of this publication), backed by extensive information from other bird research and survey, will undoubtedly become useful in further refining these population estimates in due course. This new information will be considered in the more comprehensive Pembrokeshire Avifauna.
For other species, notably seabirds, chough and peregrine, more specific data are collected annually and this allows a more detailed assessment of population size to be made. Seabirds on the Islands and the Castlemartin coast are counted annually for the Seabird Monitoring Programme administered by the JNCC (www.jncc.gov.uk/page-1550). For all these species, there is more discussion about the population changes in the species accounts.
Density of recorded species in each atlas period
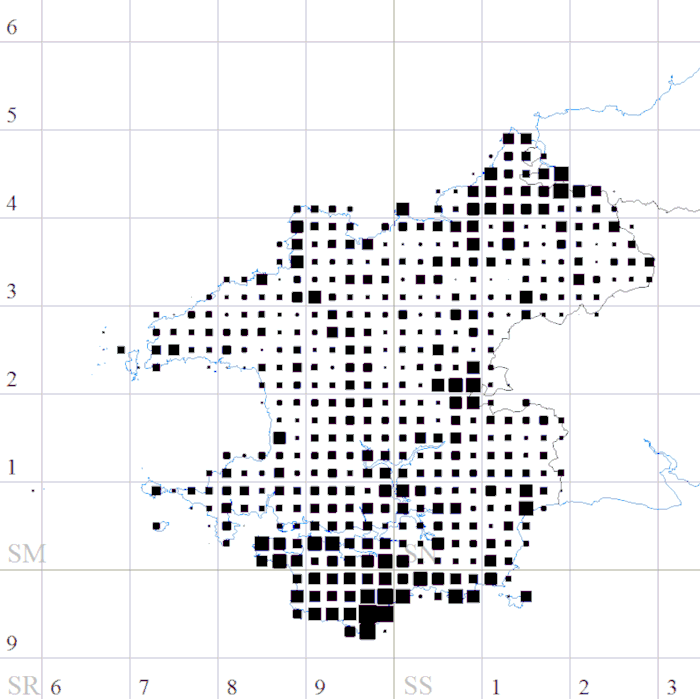 1984-88 density map. The smallest dots represent 2 species, the largest represent 86 species. The counts include non-breeding species.
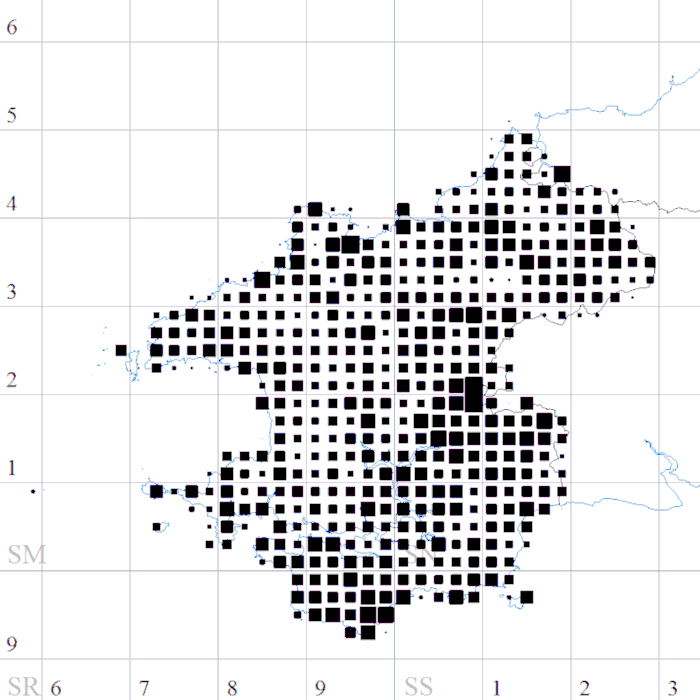 2003-07 density map. The smallest dots represent 2 species, the largest represent 81 species. The counts include non-breeding species.
The average number of species per tetrad is 35.
INTERPRETING THE SPECIES ACCOUNTS
For those species of particular conservation concern, the designation of red or amber-listing, or UK BAP or LBAP is given in the title line. Further information about these designations is given in appendix III.
A brief introduction is given for each species, followed by comments about changes in distribution and population, and a discussion of problems with calculating such changes.
Maps are not reproduced for all species, where the breeding distribution is so limited that it can readily be expressed in the text, e.g. Gannet. For some scarcer and legally protected (Schedule I of the Wildlife and Countryside Act) species, maps are provided at a 10 kilometre square level.
For the majority of species, a table shows the total number of tetrads in which the species was found, plus the numbers of tetrads that registered “confirmed”, “probable” or “possible” breeding during each atlas period. Note that for some species, for example rooks and other colonial nesting species, birds foraging in fields or in flight do not give any indication of the location of their nest sites, which may be some distance away, and therefore such "possible" breeding records have been excluded. For other species, for example skylark, the distribution was based largely on birds singing on more than one date in the same place to show they are holding territory. In these instances the maps show mostly probable breeding.

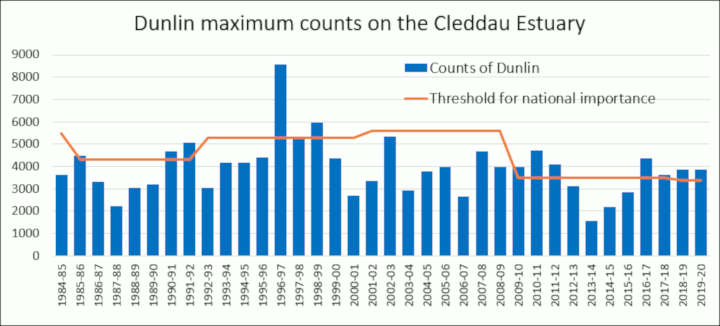
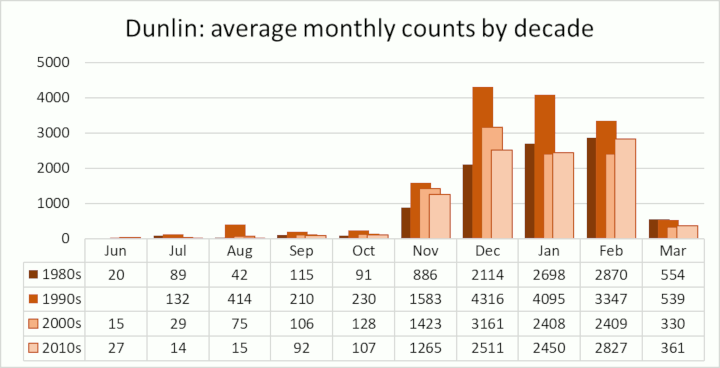
 The vast majority of redshank wintering in Pembrokeshire are found on the Cleddau Estuary.
 Pembrokeshire Avifauna committee